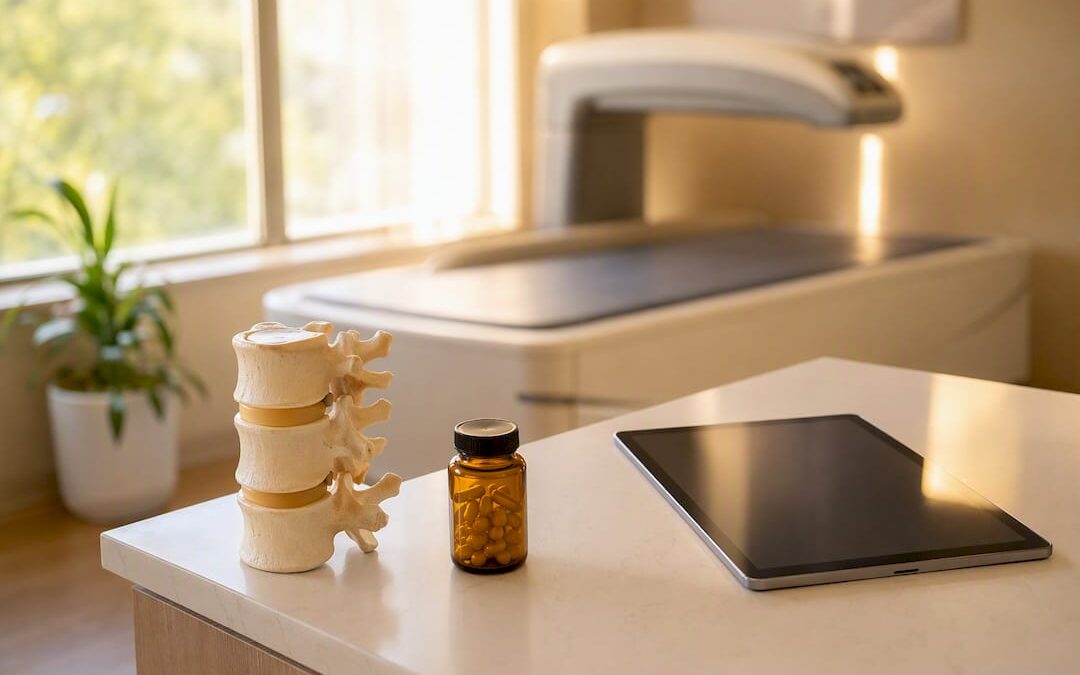
The T-score is what clinicians use to diagnose osteoporosis in postmenopausal women and men 50 and older. The Z-score compares your bone density to people your own age, sex, and body size, and it matters most when a clinician suspects something other than normal aging is driving bone loss. Both numbers come off the same DXA scan, but they answer different questions.
TL;DR:
- T-scores compare bone density to peak adult levels, making them useful for diagnosing osteoporosis in postmenopausal women and older men.
- Z-scores compare bone density to peers of the same age and are mainly used for younger individuals or unexplained rapid bone loss cases.
- Factors like machine calibration, patient positioning, and biological differences can skew DXA results, requiring careful interpretation by clinicians.
- A Z-score of −2.0 or lower often prompts investigation for secondary causes of bone loss, especially in premenopausal women and men under 50.
- Bone-loading programs like Osteostrong complement medical treatment and require prior diagnosis, with results influenced by factors beyond bone density alone.
Table of Contents
- What a DXA Scan Measures and How T-Score vs Z-Score Are Calculated
- What Does a T-Score Mean for Osteoporosis Diagnosis?
- When Do Doctors Use the Z-Score Instead?
- Reading T-Scores and Z-Scores Together: Real Scenarios
- Why Bone Density Scores Aren’t Always Straightforward
- What to Do After a Low T-Score or Z-Score Result
- How Osteogenic Loading Supports a Bone-Density Plan
- What I Tell Patients About Their Bone Density Numbers
- A Supportive Option Alongside Your Doctor’s Plan
- Where to Learn More
- Sources
What a DXA Scan Measures and How T-Score vs Z-Score Are Calculated
A DXA (dual-energy X-ray absorptiometry) scan measures how much bone mineral is packed into a specific area, usually reported in grams per square centimeter. Raw numbers like that mean nothing without context, since bone density naturally varies by machine, scan site, and person. That’s why every result gets converted into a standardized score instead.
Clinicians typically scan two or three sites, and the comparison population is what separates the two scores:
- Lumbar spine, total hip, and femoral neck are the standard sites, per RadiologyInfo.
- T-score measures your bone mineral density (BMD) against the average peak BMD of a healthy 30-year-old of the same sex.
- Z-score measures your BMD against the average for people who match your age, sex, and often ethnicity and body size.
That difference in reference population is the entire reason the two scores exist side by side on the same report.
What Does a T-Score Mean for Osteoporosis Diagnosis?
A T-score is the number of standard deviations your bone density sits above or below that young, healthy adult average. It’s not a percentage and it’s not a raw density reading. It’s a statistical distance, and the World Health Organization set the thresholds that turn that distance into a diagnosis.
T-score values are classified by the World Health Organization thresholds: scores above about −1 indicate normal bone density; scores below that but not reaching a lower threshold indicate low bone mass (osteopenia); and scores below a specific lower cutoff meet the WHO definition of osteoporosis. More negative scores alongside fracture history may be labeled as severe or established osteoporosis.
Statistic callout: A T-score of −2.5 sits two and a half standard deviations below peak bone mass. According to WHO’s technical guidance, that single cutoff has driven osteoporosis diagnosis worldwide since it was established.
The NIAMS explains the reasoning behind why age matters here: for postmenopausal women and men 50 and older, fracture risk climbs in a fairly predictable way as bone density falls further from peak mass. The T-score captures that distance directly, which makes it the right tool for this age group. It’s not the right tool for everyone, though, and that’s where the Z-score takes over.
When Do Doctors Use the Z-Score Instead?
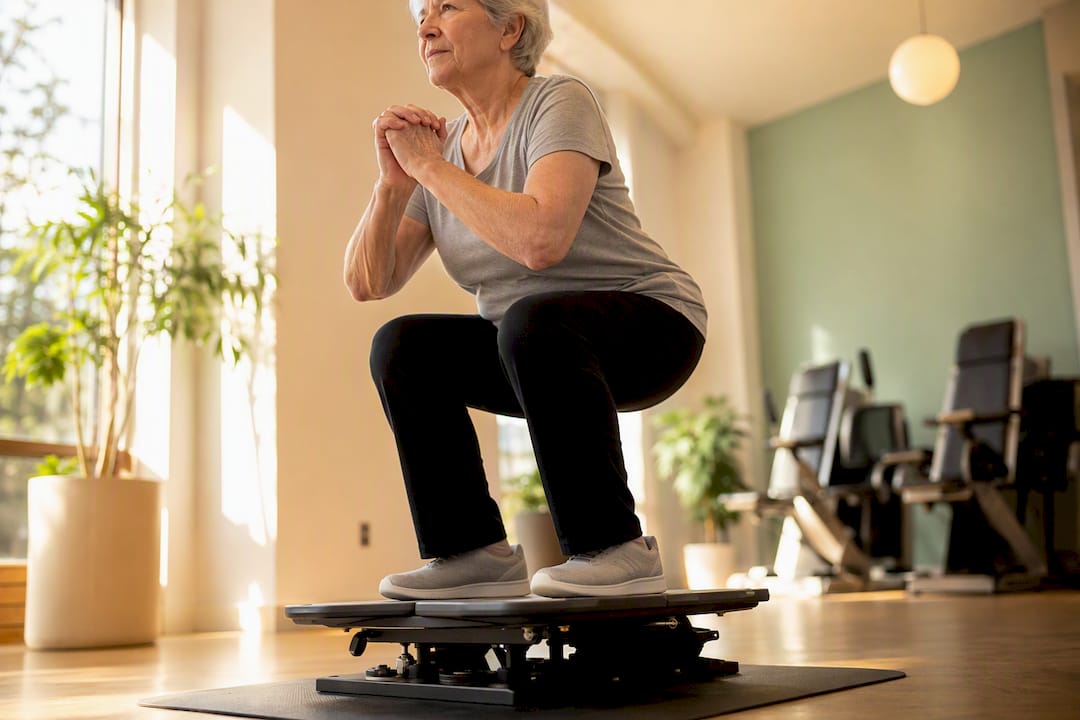
A Z-score measures the same standard-deviation distance, but against people who match your age, sex, and typically your body size, rather than against a young adult peak. For a 70-year-old, some bone loss relative to a 30-year-old is expected. A Z-score strips that expected age-related decline out of the picture and asks a sharper question: is this person losing more bone than others their age?
That question matters most in specific groups:
- Premenopausal women who haven’t yet entered the hormonal shift that accelerates bone loss.
- Men under 50, where age-related bone loss patterns differ from older men.
- Children and adolescents, where a T-score comparison to adult peak mass wouldn’t make clinical sense at all.
- Anyone with unexplained or unusually rapid bone loss, regardless of age.
Healthline and clinical literature both point to a working guideline: a Z-score of −2.0 or lower often prompts a workup for secondary causes, things like hormonal disorders, malabsorption, or certain medications rather than ordinary aging.
Reading T-Scores and Z-Scores Together: Real Scenarios
Age determines which score drives the diagnosis, but doctors rarely look at one number in isolation. A few scenarios show how this plays out in practice.
- A 68-year-old woman with a T-score of −2.6. Because she’s postmenopausal, the T-score is the diagnostic score, and −2.6 crosses the osteoporosis threshold. Her Z-score is a secondary data point here, not the deciding factor.
- A 35-year-old woman with a Z-score of −2.3. Her age puts her outside the T-score’s intended use, so the Z-score leads. A result this low, per the NCBI clinical review, typically triggers lab work to rule out thyroid disease, celiac disease, or other secondary causes rather than an automatic osteoporosis label.
- A patient whose spine and hip scores disagree. Spine-hip discordance is common, often from degenerative disc changes or arthritis artificially inflating spine readings. Clinicians weigh both sites, review scan positioning, and factor in prior fractures before finalizing a diagnosis.
When scores don’t line up cleanly with the clinical picture, the next step is usually more information, not a faster verdict.
Why Bone Density Scores Aren’t Always Straightforward
DXA results look precise, but several factors can quietly skew them. Different manufacturers calibrate machines slightly differently, and the ISCD specifically advises clinicians to account for device-specific reference databases rather than treating every DXA report as universally comparable. Positioning errors during the scan, hardware from prior surgery, and degenerative spine changes can all shift a number without reflecting a real change in bone strength.
Biological factors add another layer:
- Body size and frame affect density readings independent of actual bone strength.
- Ethnicity influences reference ranges, since population averages vary.
- Prior fractures, pregnancy, and recent significant weight change can all distort a single scan’s accuracy.
Pro Tip: Don’t trust online calculators that claim to “convert” a Z-score into a T-score or vice versa. They’re measuring against different reference populations entirely, so a mathematical conversion isn’t valid. Ask your clinician to interpret both scores directly from your actual DXA report.
What to Do After a Low T-Score or Z-Score Result
A low score is a starting point for a conversation, not a diagnosis you manage alone. Here’s the general sequence clinicians tend to follow.
- Confirm with labs. Bloodwork for calcium, vitamin D, thyroid function (TSH), and sometimes celiac serology helps rule out secondary causes, especially when the Z-score is low.
- Estimate fracture risk. Tools like FRAX combine your T-score with clinical risk factors to estimate 10-year fracture probability.
- Discuss timing for a repeat scan. Your clinician determines the right interval, since scanning too soon won’t show a meaningful change.
- Review treatment options. This can include nutrition, targeted exercise, fall-prevention strategies, or prescription therapy, depending on severity.
Seek care sooner rather than later if you’ve had a fragility fracture (a break from a minor fall or bump) or if a repeat scan shows rapid loss. Those are signs that waiting for the next scheduled scan isn’t the right call.
How Osteogenic Loading Supports a Bone-Density Plan
Osteogenic loading applies brief, controlled mechanical force to bone to stimulate a strengthening response, the same basic principle behind weight-bearing exercise, just concentrated and measurable. DXA changes show up slowly, often over months to years, so this kind of loading works as a consistent input alongside whatever your physician has already recommended.
These programs are built to complement medical care, not replace it. When you already have a diagnosis and a treatment plan, coordinating mechanical loading with your clinician’s guidance is what makes the combination worthwhile.
What I Tell Patients About Their Bone Density Numbers
If you’re over 50, your T-score is the number that drives the diagnosis conversation. If you’re younger, or your loss seems out of step with your age, the Z-score is what should send you back to your doctor for answers. Either way, talk through your specific result and follow-up plan with a clinician who can see your full history.
— Aaron
A Supportive Option Alongside Your Doctor’s Plan
Osteostrong is not a substitute for medical diagnosis or treatment, it’s a mechanical loading program designed to work alongside whatever your physician already recommends after a DXA result. Sessions are brief, once a week, and focus on delivering the kind of mechanical stimulus bone tissue responds to over time.
Beyond the core osteogenic loading sessions, Osteostrong locations offer complementary recovery tools like red light therapy, PEMF mats, and vibration plates, things you can fold into a broader bone-strength routine once your clinician has weighed in on your T-score or Z-score result. If you’re curious whether the evidence behind osteogenic loading fits your situation, that’s a good place to start reading. When you’re ready to see how sessions work in person, you can find your nearest Osteostrong location and book an initial consultation to talk through your goals.
Where to Learn More
- NIAMS: bone density test basics
- ISCD official positions
- MedlinePlus: bone density scan overview
- WHO bone mass assessment guidance
Sources
- Bone Mineral Density Tests: What the Numbers Mean | NIAMS
- WHO technical guidance on bone mass assessment
- ISCD official positions — Adult positions
- DEXA information — RadiologyInfo